Most people when they collect data will not question the accuracy of the data, but there is always the possibility that the data is NOT accurate! Inaccurate data is in some ways worse than no data, because at least you know when you have no data, but when making decisions with inaccurate data you may not even know it so there is a high risk the wrong decisions will be made.
Consider the diagram below. If you measure a component and find the result is just inside the tolerance limit, do you accept or reject the component? This could be a product with a tolerance, or a service feature. Most people would accept it.

But what about if you found out that there was a measurement system error that meant you were unsure of the actual result? The true result could be inside or outside the limit. Would you now accept or reject the component or service?
If you accept it there is a risk that it is actually outside spec and will not meet customer requirements, either as a product or service. Doing this passes the risk on to the customer. If you reject it there is a risk that it is acceptable, so the risk is with the organisation, you are wasting a perfectly good component!
Measurement systems can take many forms, they are not restricted to physical measurement systems such as micrometres and gauges, but also include surveys, exams, reports. All these things potentially have inaccuracies.
A measurement system can be considered in the same way as any other process, and we can use the fishbone diagram to consider what could cause measurement system error. Causes could include manpower (people using a gauge in different ways for example, or calculating on time delivery in different ways), methods (carrying out the measurement in different sequence), machine (using different equipment to carry out the same measurement), material (cleanliness of parts affecting the results), mother nature (temperature affecting the result).

If we consider our measurement systems as processes then we can start to see the potential for error is significant.
MEASUREMENT SYSTEM ERROR
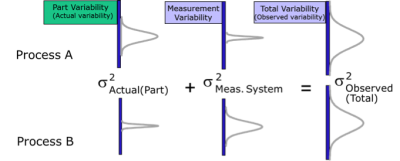
If we have a measurement system result, we are invariably looking at the combination of the part to part variation and the measurement system variation.
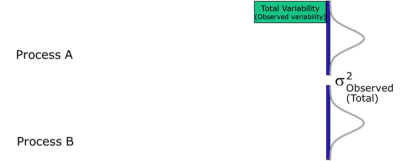
Consider the diagram below. If we observe an amount of variation on the right hand side, which process is best, A or B? The answer is we cannot tell, they appear both the same.

Now however suppose we understand that the measurement system variation for process A is much less than for process B, which process is best? The answer is process B, because we understand that what we are observing is mostly due to measurement system variation and not process variation.

We can see from this example that an understanding of how much our measurement systems varies compared to our process is essential to make proper decisions.
There are six components of measurement system error:
- Resolution/Discrimination
- Accuracy (bias)
- Linearity
- Stability (consistency)
- Repeatability (Precision)
- Reproducibility (Precision)
All six of them need to be in order for the measurement system to be adequate!
COMPONENTS OF MEASUREMENT SYSTEM ERROR IN DETAIL
Resolution
Resolution is the capability to detect the smallest acceptable change. An example of poor resolution would be trying to measure a component to the nearest fraction of a millimetre with a ruler that has a scale that only goes down to millimetres.
General guidance is that the measuring method should be able to “resolve” to at least 10 times more than the tolerance, so for example if the tolerance for measuring the length of a shaft is ±0.5 mm than the equipment should be capable of resolving to at least 0.1 mm. A ruler of course will not be suitable for this.
Resolution is not just an issue in the factory, but also in the office. Consider for example the form shown here designed to collect data on time to fulfil a customer request. The first form does not collect time in hours, only in days, so it does not have enough resolution to answer the question how many hours does it take.

Adding a row to include time of raising the order and shipping the order improves the resolution.
To deal with resolution issues there are several choices. These include:
- Use a device that can measure to a greater resolution
- Move to a sample and record an average
- Live with it, but understand the repercussions – which may be:
- Cannot tell one component from another
- Cannot tell where component lies within upper and lower specification limits
- Cannot accurately Centre Process
- Cannot Improve the Process
Accuracy/Bias
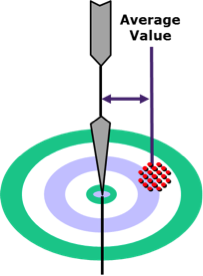
Accuracy or bias is the difference between the observed average value of measurements and the “true” or master value. The master value should be traceable to some reference standard. In calibration this traceability is a key aspect of the process, and must be traceable back to a National standard reference.
Consider the example of throwing darts at a bull’s eye. If the throwing is accurate then on average the darts will hit the bull’s eye, even if none of them actually do! The pattern observed will be darts equally distributed around the bull’s eye.

A less accurate thrower will not have darts around the bull’s eye, but will have darts clustered either to the left or right. An example of an inaccurate gauge could be a tape measure with a worn end, so it will always read lower than the true reading.
Accuracy or bias can also be an issue with attribute data for example consider the employee satisfaction form shown, is there any potential for bias in the results? What could be done to reduce bias?

Actions to reduce the likelihood of bias include:
- Calibrate regularly
- Use operations instructions
- Validate Data Systems input accuracy
- Create Operational Definitions
- Data Cross Checks
Linearity
Linearity is an extension of accuracy, and means that over some of the rage the measuring system is accurate but over other ranges it is not. An example of this could be a tape measure that stretches. The tape will be close at lower readings, but as the distance increases the tape will stretch more and the inaccuracy will get worse.
Linearity is also relevant in attribute systems, consider the example shown here of a survey to capture customer feedback. The scale is biased towards good feedback and is not linear. Survey respondents are likely to find difficulty differentiating between the good points on the scale and the survey is likely to give results biased towards good feedback.

Linearity actions could include:
- Rebuild/Replace Gauge
- Use only over a restricted range
- Use with a correction factor/table/curve
Stability
Stability means the ability of the measurement system to give consistent and predictable results over time, in other words accuracy remains constant. Unstable equipment will vary over time.
For a stable instrument there should be no drifts, sudden shifts or cycles. Wear in the instrument could cause instability. An example of the instability would be a measuring device that requires a part to be replaced every six months
Stability actions can include:
- Ensure equipment is properly cleaned and maintained
- Use control charts
- Use/update current SOP
- Ensure adequate training
- Regular audit
Precision
Precision is the ability of the measurement system to consistently give the same result. Precision is different to accuracy which is about hitting a target value on average.
There are two components of precisions: repeatability and reproducibility. Repeatability is the ability of the equipment to give the same result when repeated measurements are taken under the same conditions; reproducibility is the ability of the equipment to give the same result under different conditions (for example different operator).
A study to look at the effects of repeatability and reproducibility is called an R&R study.
Actions to reduce repeatability and reproducibility include:
- Repair, replace, adjust equipment
- SOP
- Training